Student Resources
Day 2: Initial Project Description and Research
This project combines lessons in both math and history to help you look at data and interpret the results to understand demographic shifts for the population in your group. You will be split up into 5 groups and will research one of the following populations:
1. The School
2. The City
3. The State
4. The Country
5. The World
Your job during the research phase is to go online with your group and find resources to put together cultural demographic data for your population. As an exit ticket on day 2, you will turn in a copy of your research. Your research should include any data tables you have created, graphical representation of the trend over time and a prediction for the future. Include references for the locations you found your data and write out any explanations that may be required to explain how you got to your predictions.
First, look at current data
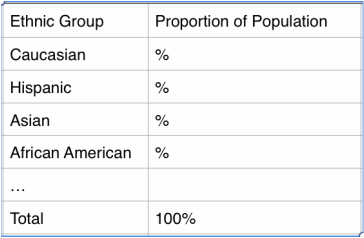
You will look for the proportion of people who are represented by each of the cultures in your population. You can make a chart as simple as the following one. The ethnic groups listed will change depending on your population.
This project combines lessons in both math and history to help you look at data and interpret the results to understand demographic shifts for the population in your group. You will be split up into 5 groups and will research one of the following populations:
1. The School
2. The City
3. The State
4. The Country
5. The World
Your job during the research phase is to go online with your group and find resources to put together cultural demographic data for your population. As an exit ticket on day 2, you will turn in a copy of your research. Your research should include any data tables you have created, graphical representation of the trend over time and a prediction for the future. Include references for the locations you found your data and write out any explanations that may be required to explain how you got to your predictions.
First, look at current data
You will look for the proportion of people who are represented by each of the cultures in your population. You can make a chart as simple as the following one. The ethnic groups listed will change depending on your population.
Second, look at historical data
The length back of data that you may be able to find will depend on the population that you are researching. Look back as far as you reasonably can and find a graphical way to present the data so that you are presenting how the cultural demographics are shifting over time.
Third, make a prediction for the future
The last part of your assignment is to make a prediction for the demographics in the future. Again, how far in the future will depend on how far back you have data, but make a prediction as far out as is reasonably possible.
There is a wealth of information available to you on the internet. Here are a few websites you may try to get started.
Carlsbad City data: http://www.city-data.com/city/Carlsbad-California.html
California vs. US: http://quickfacts.census.gov/qfd/states/06000.html
Census File on Wikipedia: http://en.wikipedia.org/wiki/File:Census-2000-Data-Top-US-Ancestries-by-County.svg
